With hundreds of metrics available to you every day, which ones should you focus on? What are the most important ecommerce metrics you need to track?
You’ll be surprised that traditional metrics, such as traffic or conversion rates, while important, didn’t make the top 7 list. Why? Because if your goal is to grow your brand, an improvement of either of those metrics doesn’t necessarily indicate your business is growing.
You might be getting a lot of new traffic from sources that don’t engage or convert. Or you might be getting a higher conversion rate if your traffic composition changed. Your existing customers convert at a higher rate than new prospective customers, so if you’re getting more traffic from email and SMS, and less from advertising, your conversion rate will increase, but that doesn’t mean that your website is performing any better. However, you don’t want to burn out your subscribers by communicating too frequently, and you don’t want to stop prospecting for new customers because that would stale growth.
The key to success is optimizing for the right metrics. We’ve all dealt with retail employees working on commission and felt that they cared more about getting their bonus than helping us find the right product. If you chase after the wrong metrics, you’ll take your brand in the wrong direction. So, what are the right metrics to focus on?
Net profit
It’s not about how much money you make. It’s about how much money you keep.
Any business decision should take into account how much revenue it’s expected to generate and the costs associated with it. And when I say costs, I mean all the costs: advertising, agency fees, salaries, rent, cost of goods sold, payment processing fees, discounts, and returns.
Only then you can determine whether an investment makes sense (i.e. revenue is greater than cost) or not (i.e. cost is greater than revenue.)
It’s Economics 101, but you’d be surprised at how few brands analyze the fully-loaded cost of every project or marketing initiative they take on.
It’s very helpful to visualize how the money flows from top-line gross revenue to bottom-line net profit, so you can clearly understand what happens to all the money that comes in.
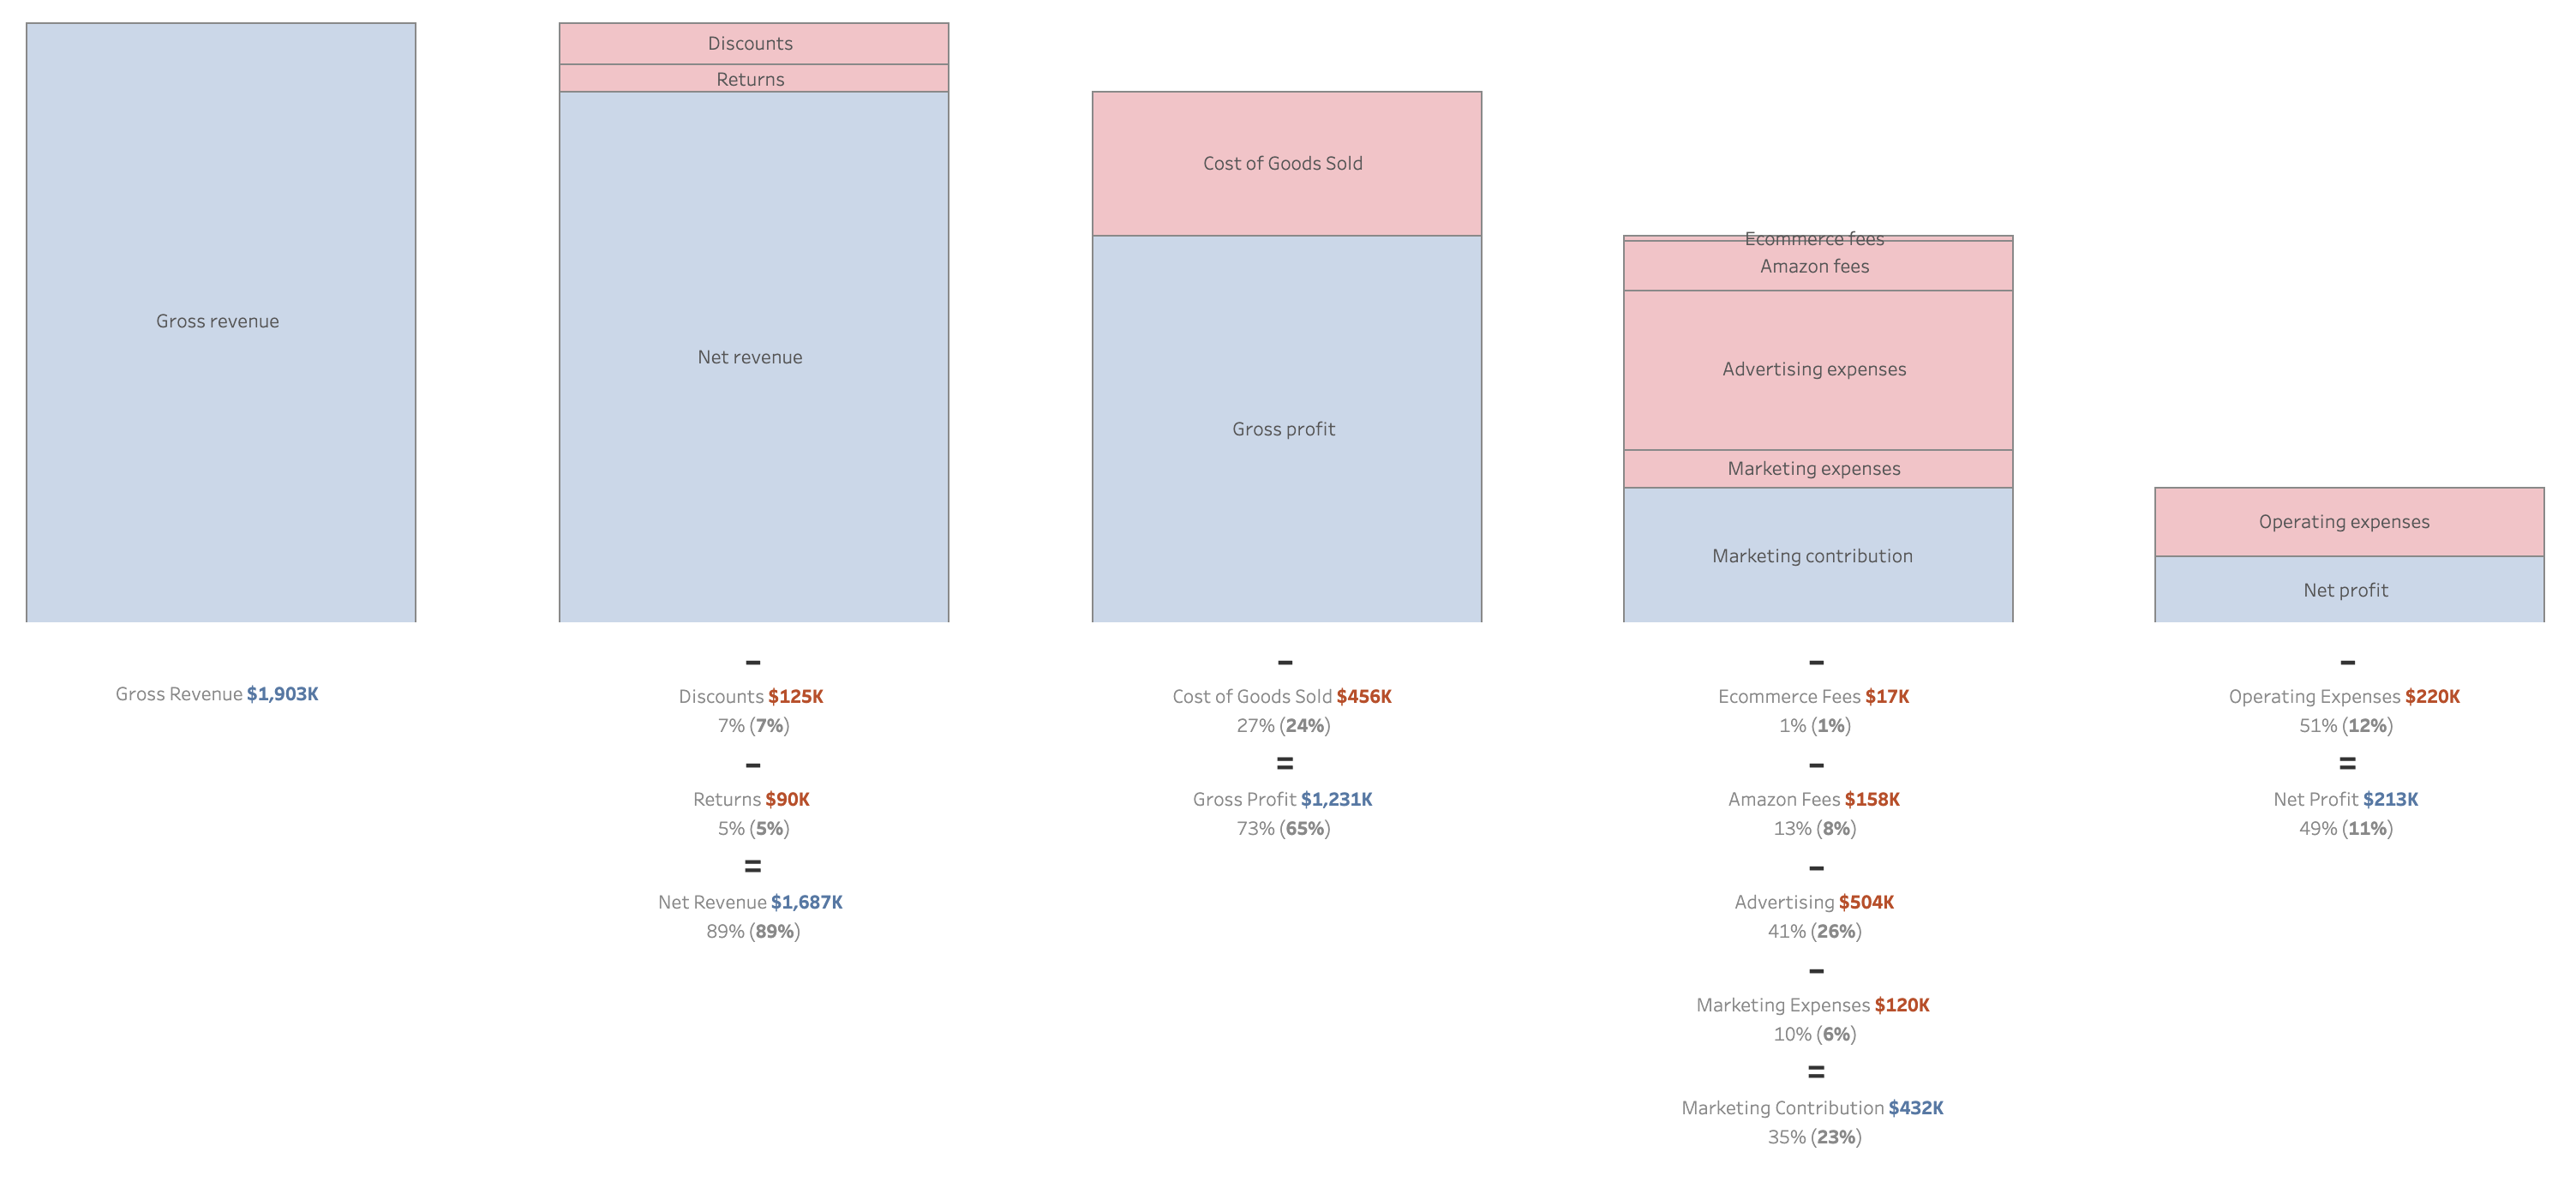
The biggest hurdle preventing brands from making informed data-driven decisions is the time it takes to pull data from different sources and manually create reports. For that reason, automating your reporting is the single most important thing you can do to become a data-driven brand.
Integrating your sales data (Shopify, Amazon, etc.) with your cost data (cost of goods, selling fees, advertising spend, marketing expenses, and operating expenses), is critical to track net profit in real-time and understand how much of each revenue dollar you get to keep.
Customer lifetime value (CLTV)
If you don’t know how much a customer is worth, how can you decide how much you can afford to acquire them?
When it comes to CLTV, you want to know:
- The average CLTV
- How it builds up over the customer’s lifetime
- How #1 and #2 vary by customer segment
The average CLTV is very easy to calculate: it’s the total revenue divided by the number of customers. If you made $20M and that came from 200,000 customers, each customer spent $100 on average.
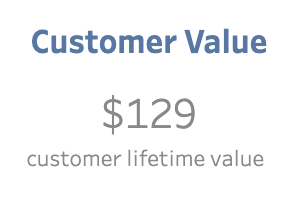
Average customer lifetime value (CLTV)
Using the average is convenient because it’s easy to figure out and works well for back-of-the-envelop math, but it isn’t always useful for a number of reasons.
First, it doesn’t take into consideration when customers were acquired. Someone who has been a customer for 10 years probably spent much more than someone who became a customer 10 days ago. So, while the average is $100, the first person probably spent $180 and the second one only $20. That’s why it’s essential to understand how that lifetime value builds up over time.
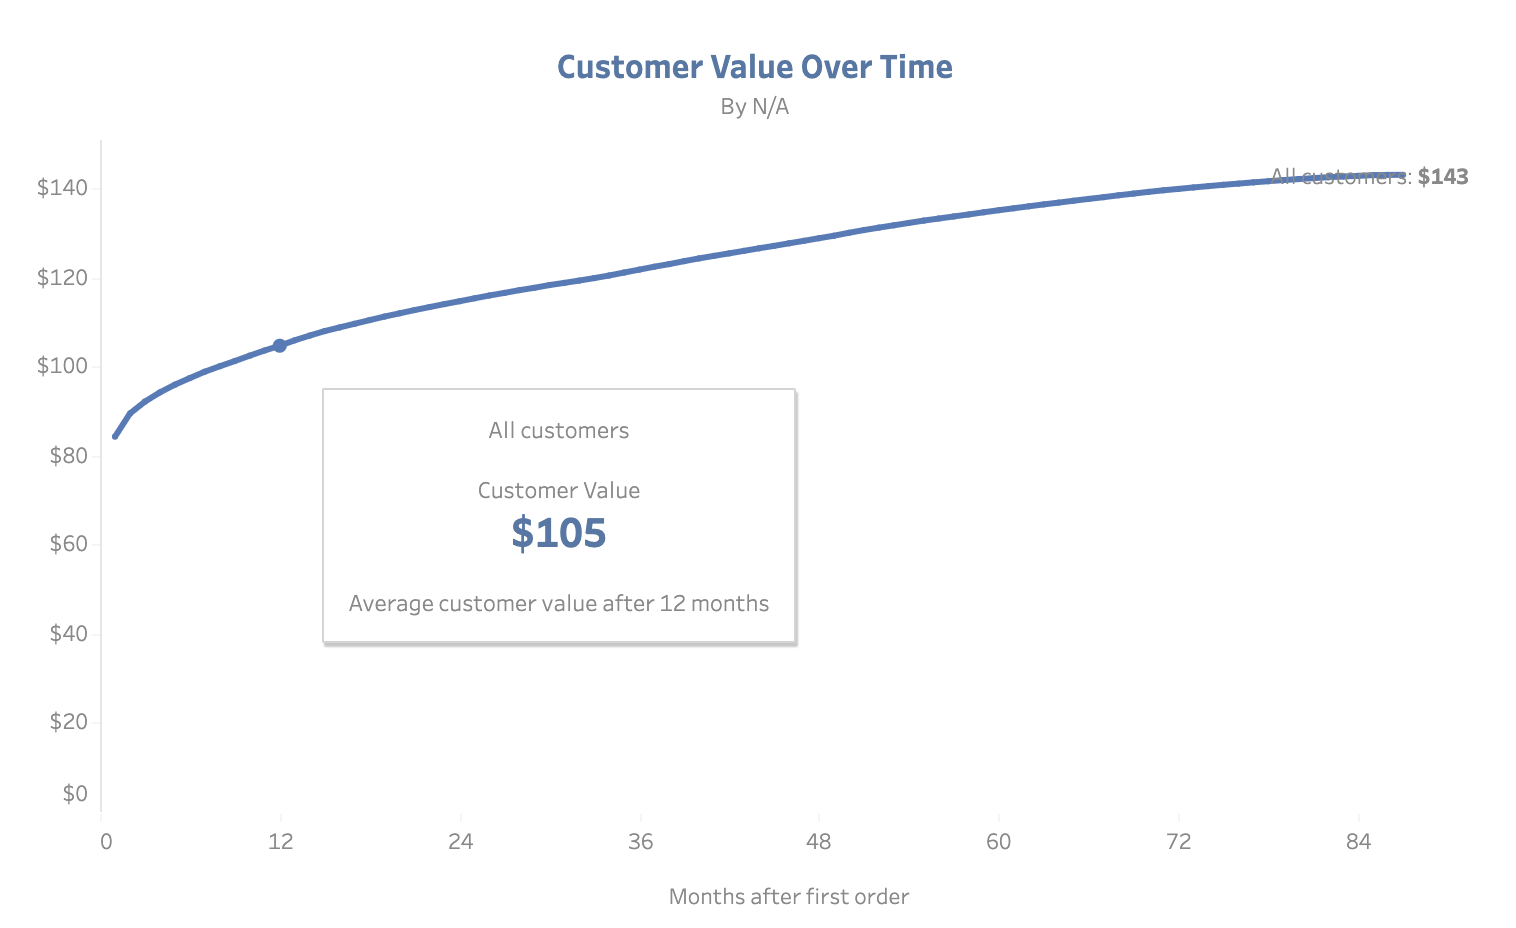
Customers spent $84 in the first month, $105 in the first year, and $143 after 7 years.
The second reason averages aren’t very useful is that they lump together all customers, those buying $1,500 laptops and those buying $25 phone cases. That’s why it’s important to segment your customers in many different ways to identify your most valuable segments.
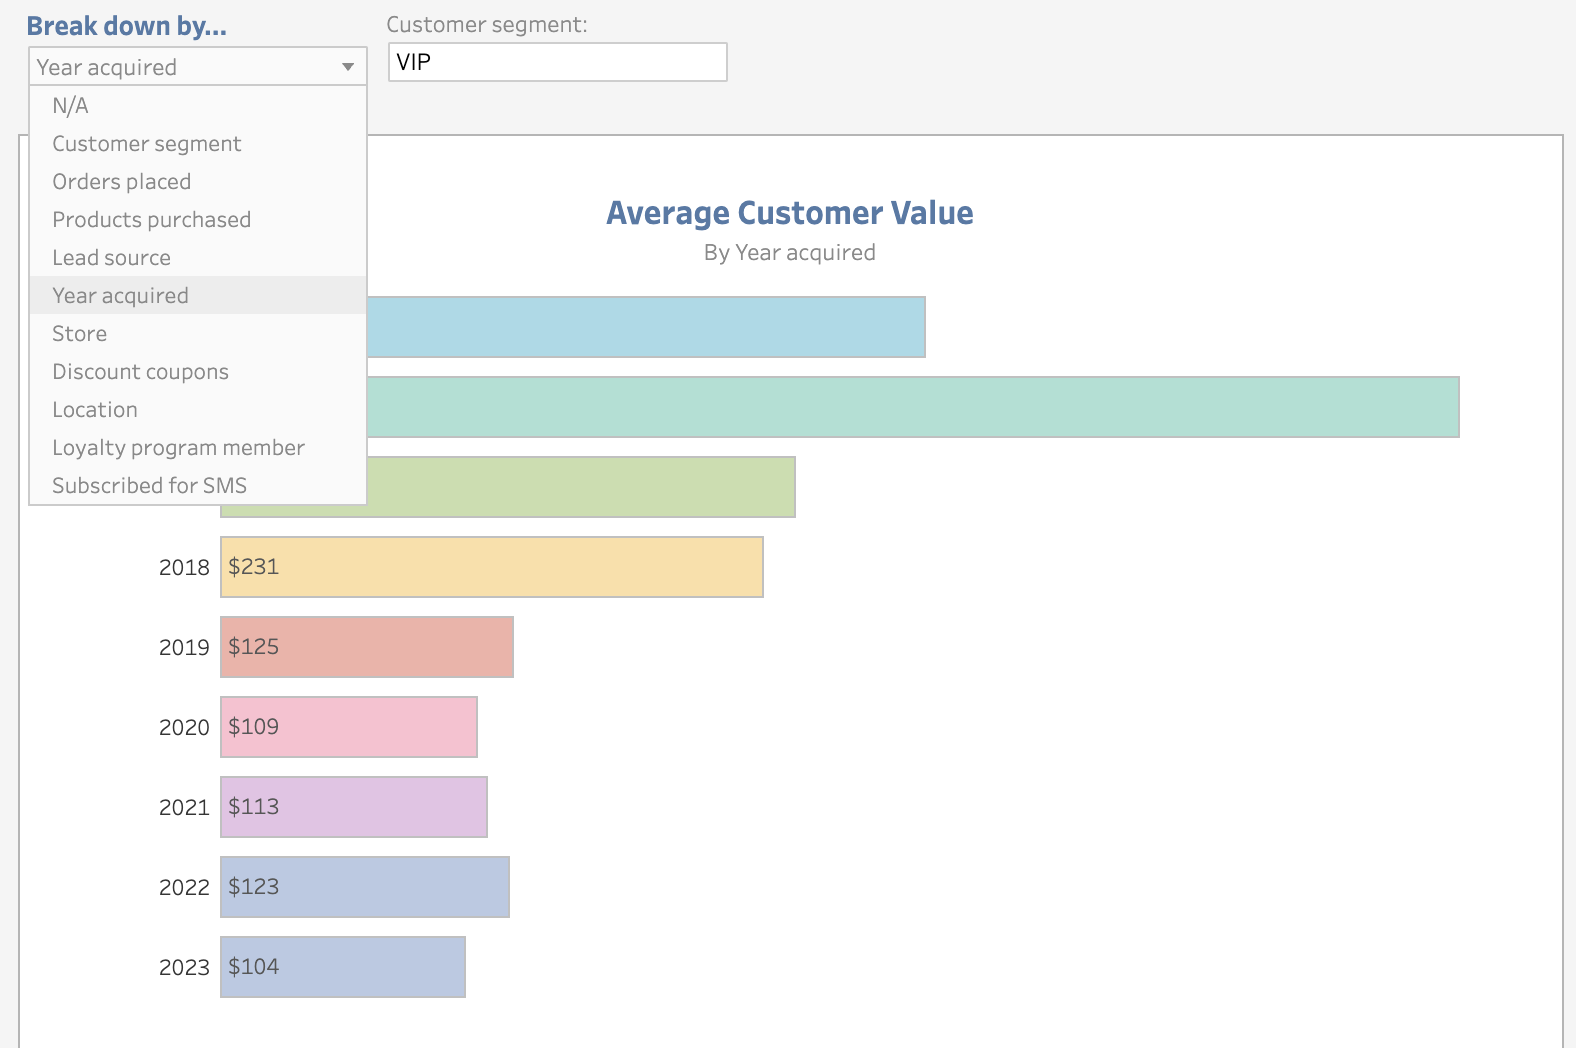
It’s very insightful to segment customers based on when they were acquired, how you acquired them (e.g. which ad campaign), what products they purchased, and whether they used discount coupons, or have signed up for your loyalty program or SMS updates.
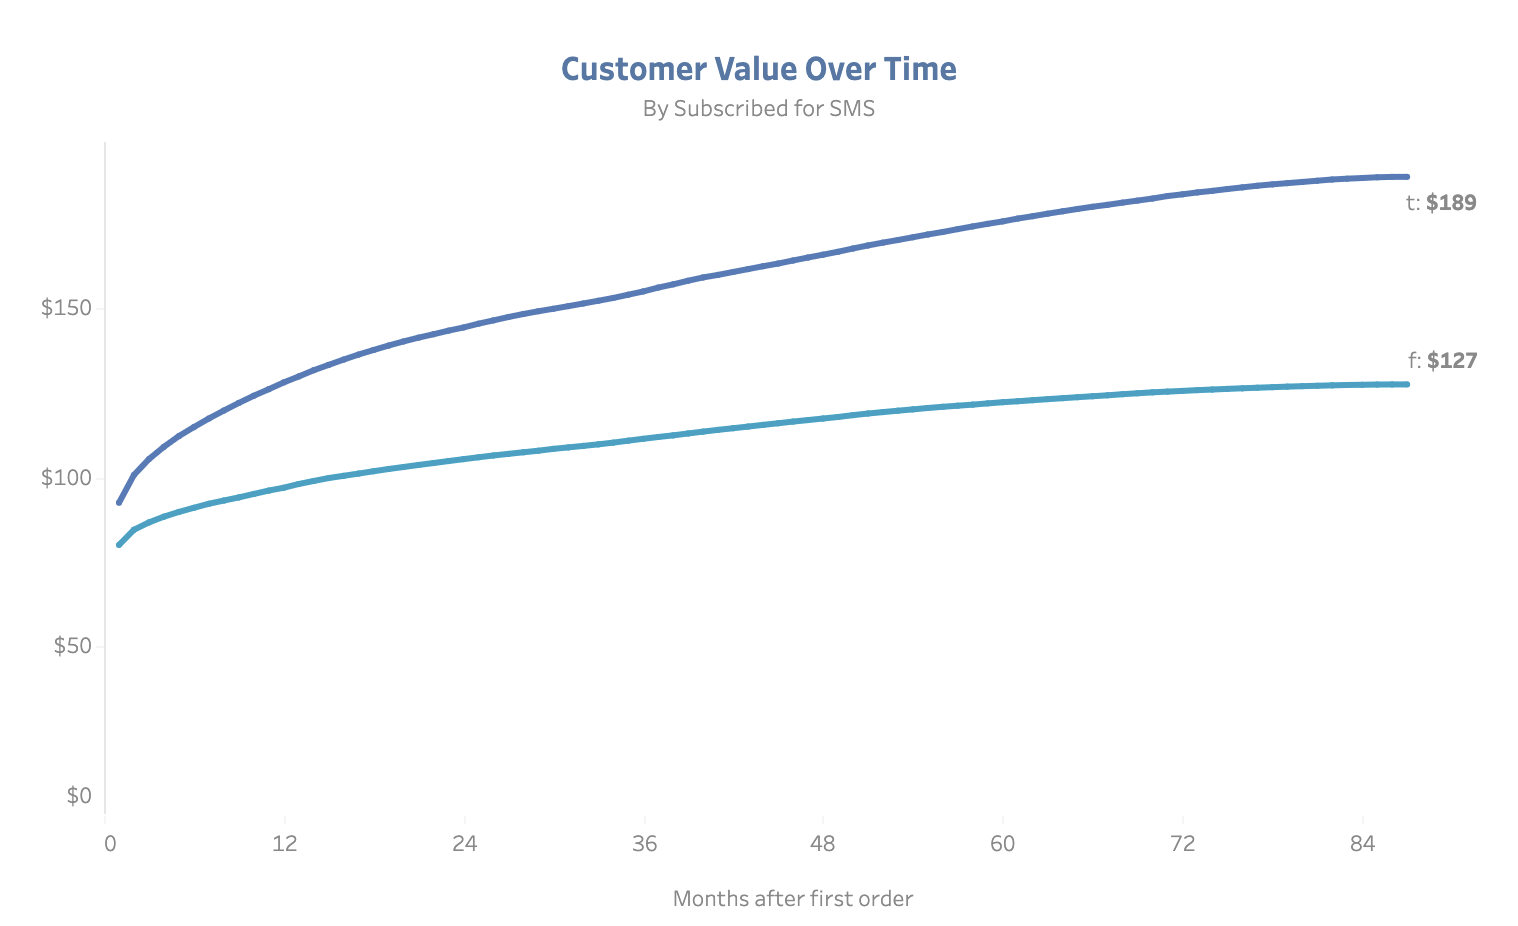
Visualizing CLTV over time by segment is the most powerful way to understand your customers’ spending patterns.
Cost per acquisition (CPA)
Once you know how much each customer is worth, you’re very close to figuring out how much you can invest to acquire more of them. To calculate your target CPA, you need to define two parameters on your analytics platform:
- Your gross profit margin
- When you expect to recoup your investment
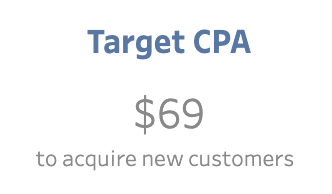
Your target CPA is the most you’re willing to spend to acquire a new customer.

To calculate your target CPA, define your gross profit margin and when you expect to recoup your investment.
Let’s assume you get $40 in gross profit from a customer’s first purchase and a total of $100 in the first 12 months. In this scenario, most brands would be happy with a $50 CPA because although they wouldn’t recoup their investment right away, they would double their investment within a year.
Every brand has a different break-even target. If you have very low cash reserves, you might not be able to lose $10 today to profit $50 by the end of the year. Conversely, if you’re a well-funded brand, you might be okay waiting 24-48 months to start profiting from each new customer.
We found that 12 months works well for most brands because it’s a good balance between their growth objectives and cashflow situations.
Why does knowing your target CPA matter? Let’s say that you’re investing heavily in a Facebook Ads campaign delivering new customers at $50 each. Is that a good investment? Should you invest more in it, or pull the plug? If your target CPA is $100, then acquiring customers for $50 is a great deal and you should be investing as much as you can. But if your target is $40, then you might want to shut down that campaign.
Return on ad spend (ROAS)
All advertising platforms report CPA and ROAS (although they all have different names for them.) In a way, these two metrics provide similar insight. CPA is the total spend divided by the number of orders, whereas ROAS is the total revenue divided by the total spend.
CPA focuses on orders and ROAS focuses on revenue. When does it make sense to use CPA, and when does it make sense to use ROAS?
The beauty of CPA is its simplicity. If you know how much a customer is worth, then you know how much you can spend to acquire such customer. However, it doesn’t take into account the value of each order. A $100 order is twice as valuable as a $50 order. For that reason, it’s always a good idea to have a target ROAS in addition to a target CPA to evaluate the performance of advertising channels.

If your average order value (AOV) is fairly consistent, make CPA your primary metric to evaluate advertising performance. If your AOV fluctuates a lot, ROAS might be a better indicator.
New customers
Okay, so you have a healthy net profit margin, a clear understanding of how much your customers are worth, and you’re acquiring them for less than they’re worth. Now what? At this point, it’s all about scaling up and getting as many new customers as you can.
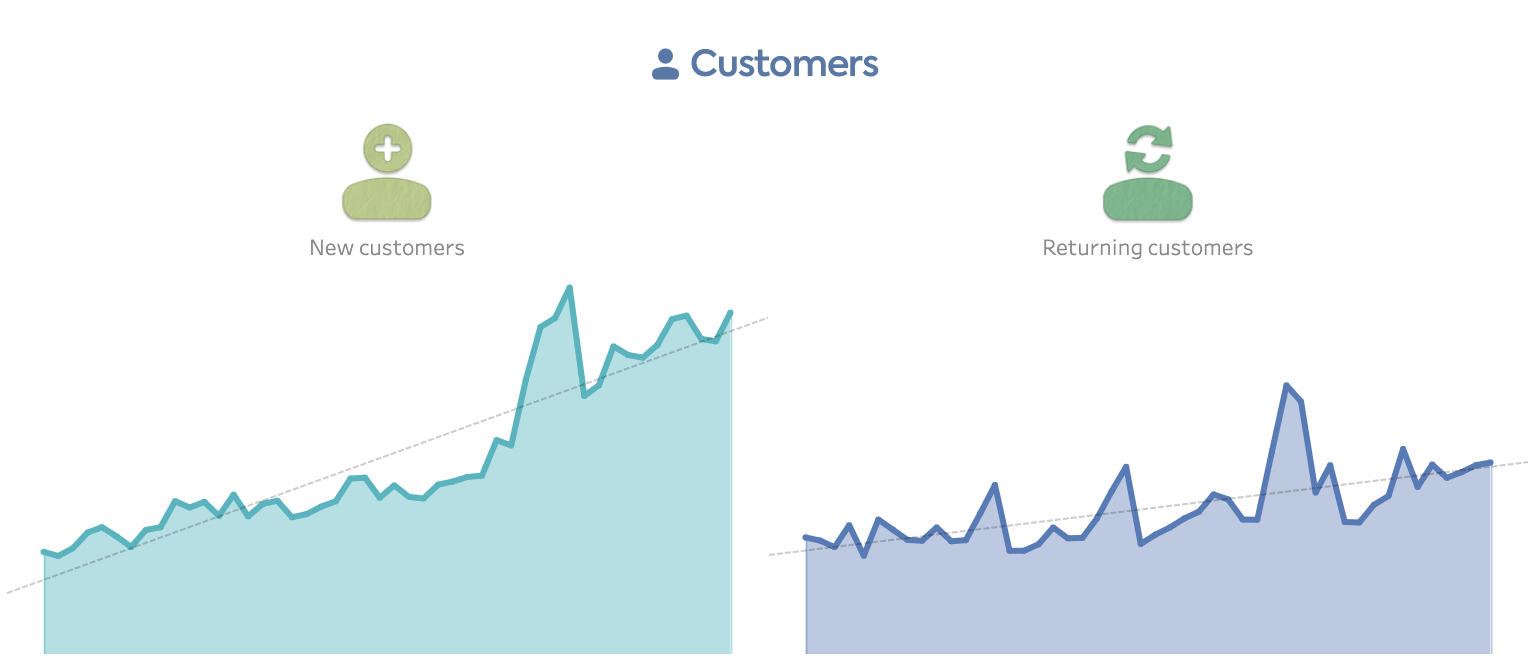
New customers are the lifeblood of your brand. If your new customer acquisition slows down, you might not notice that effect on your revenue right away if your customer retention channels (e.g. email, SMS, etc.) are performing well. But if the pipeline dries out, you’ll be in deep trouble. You need to be proactive and prevent this from happening before it’s too late.
Today’s new customers are tomorrow’s returning customers. Growing your customer base creates a larger pool of people who will be seeing your marketing messages and retargeting ads. And because it’s about 20X more expensive to acquire a new customer than to get a sale from an existing one, the more new customers you acquire today, the more efficiently you’ll be able to generate revenue in the future.
The number of new customers and returning customers are usually highly correlated. Assuming it takes new customers three months to make a second purchase, if you see the number of new customers slow down today, you can expect revenue from returning customers to follow suit in three months too. I repeat: don’t let the pipeline dry out. If you don’t see your new customers metrics increase, jump on it immediately.
Retention rate
The retention rate is the percentage of customers who bought within a time period that returned to purchase again. For example, if 100 people placed orders in January and 25 of them purchased again since then, that’s a 25% retention rate.
It seems simple, but it isn’t. To properly calculate retention rates, we need to normalize the data, which means comparing apples to apples. In this case, that means defining a return window. That is, when we expect customers to come back.
Consider this scenario. Someone who purchased a year ago had an entire year to make another purchase, while someone who placed an order yesterday is unlikely to have placed another order since then. So, if we were to compare the retention rate from a year ago to this month’s without establishing a return window, we’d wrongly conclude that we’re now doing a much worse job at retaining customers.
When it comes to deciding the return window, consider the time between orders. We can use the average time to keep it simple, or evaluate it based on the products purchased.

If you want to calculate retention rate across all your customer segments, use the average days between orders as the return window.

If you want to analyze retention for a specific customer segment, use that segment’s frequency (the time between orders) as the return window.
In this example, if we wanted to analyze the retention for the Series 2 segment, we could set the return window to 87 days to see how retention has changed over time.
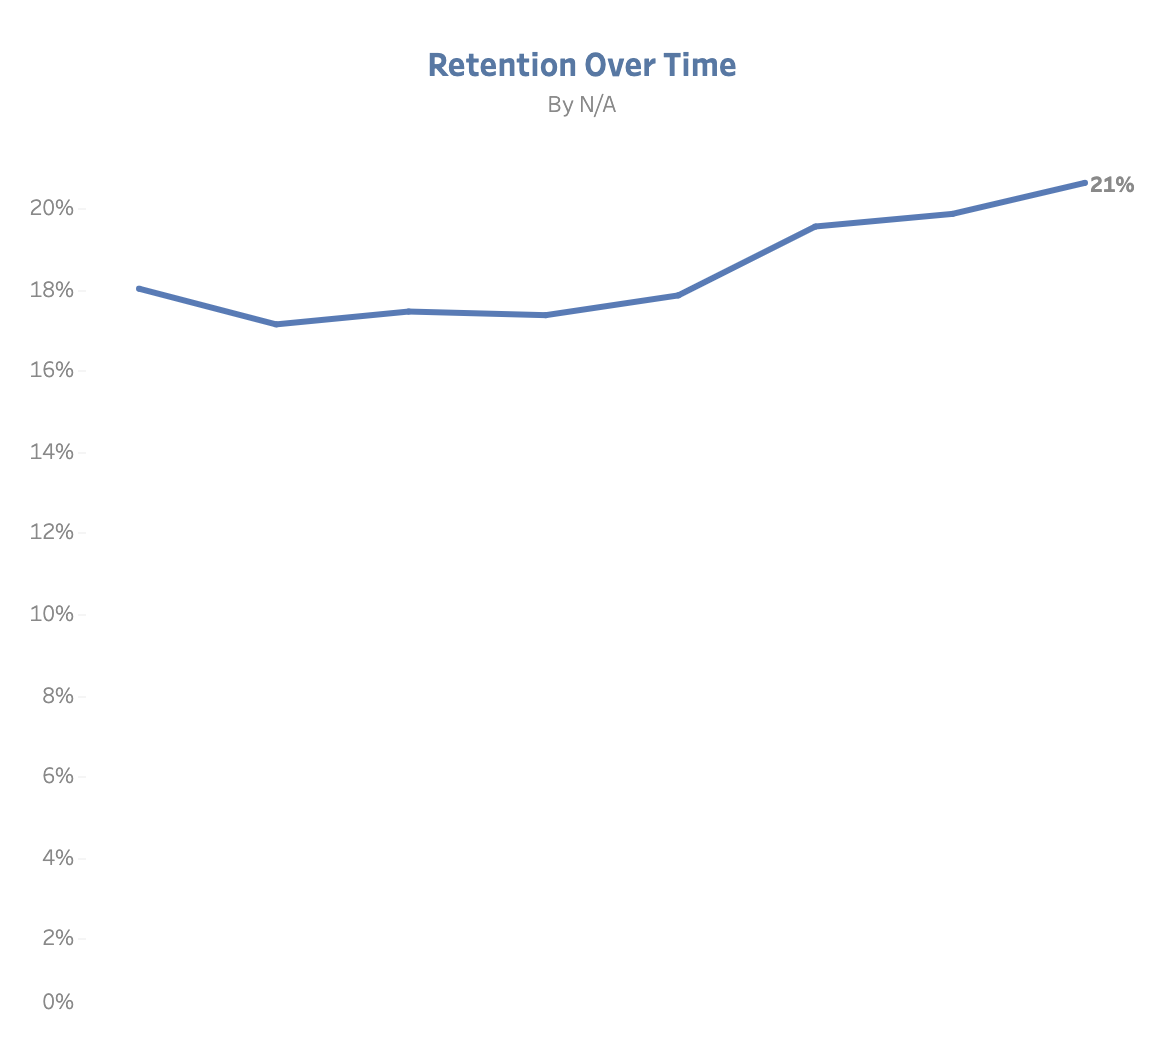
Retention rate over time
Feel free to play around with different return windows. In this example, we used 87 days because that’s the median return time (i.e. half of the returning customers purchase again within 87 days after the initial purchase, and the other half after 87 days.)
Changing the return window will change the retention scores. If you decrease it to 10 days, it will only show customers who returned within 10 days of their first purchase, so it will bring the retention score way down. If you increase the window to 365 days, it will increase the retention score materially.
However, keep in mind that the retention trend will exclude the last X days, with X being your return window. If you set it to 365 days, it will exclude the last 365 days because someone who placed his first order last month hasn’t had a full year to return yet, so you’d be comparing apples to oranges if you included them in the analysis.
Opt-in rate
At this point, you’re running a profitable business, acquiring a lot of new customers for a CPA lower than their CLTV, and you’re doing a great job retaining them. There’s one more metric you need to keep a very close eye on: opt-in rate, the percentage of your ecommerce store visitors that give you permission to communicate to them via email, SMS, browser notifications, and other owned channels.
Owned channels are materially more cost-efficient than paid channels. While your average cost-per-click (CPC) might be around $3, the average email/SMS sent might be around $0.15 –and have a much higher conversion rate.
You should be A/B testing opt-in calls-to-action like crazy. Test different offers, visuals, and copy. Test popups, fly-outs, full-page, and bubbles. Deploy exit intent opt-in units for desktop devices. Personalize your creatives based on where they appear, and set up custom triggers based on user behavior. Obsess over converting as much traffic as possible from paid to owned.
Remember: it’s 20X cheaper to market to owned channels than paying for clicks. So, when you buy media, maximize your ROI by getting permission to market to your audiences through most cost-efficient channels.

Thank you for reading! Check out how we help digital brands grow faster, learn more about our all-in-one analytics platform, or schedule a call to see a demo. Data Speaks. What is your data telling you?

